- UAE: +971 2 552 6112, +971 5644 18773
- Qatar: +974 7799 1367
- Oman: +968 95526718
- India: +91 94498 32299
- Africa: +253 7723 2251
Menu
Menu
A I M – Asset Integrity Management
Home | A I M
Protecting your physical plant assets anytime - anywhere
Information and communication are critical to effective and efficient water treatment program operations. GWTS’s latest development, Asset Integrity Management online toolbox ensures that the following critical information regarding your programs is readily available in a central, secure, online account:
- Safety Data Sheets
- Product Data Sheets
- Equipment Details
- Operational Procedures and Manuals
- Test Results
- Service Reports
- Laboratory Analysis and Inspection Reports
- Pictures
- Program Reviews
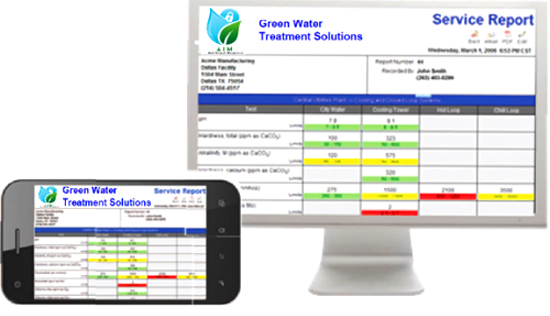
Sample Report
Overview
Modernize your company’s ability to collect, analyze, and access both wet test and controller data with eServiceReport, the leading data logging and analysis software in the water treatment industry. Our software is web-based and is accessible from anywhere simply by using an Internet connection and standards-compliant web browser. Each user has their own account complete with customized security settings that allow them to enter, view, and analyze wet test data results.
Online Reporting
Communications
Every user on the site can be configured to automatically receive email alarm notifications for out-of-spec test results that include detailed information such as the time, date, control range, person who entered the result, and any comments for each specific test. In addition to sending emails for individual alarms, all reports – including service, operator, lab, or inventory – can be set to be automatically sent in PDF format to any email address.
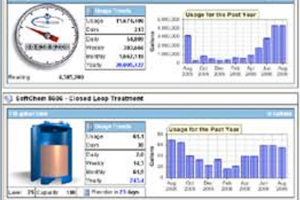
Inventory Management
Sample Report makes inventory management easy with tools designed for inventory tracking and viewing historical usage. Users can enter water meter and product usage manually or pull data from the controller’s level sensors*. Product usage and water meter readings can be viewed on a per-day to an annual basis. Using data from level sensors, eServiceReport can display a current view of product in a tank as well as the number of days remaining until the reorder point is reached. Users can access both MSDS and product data sheets in PDF format. Sample Report even features an order request form that allows a user to place product orders via email.
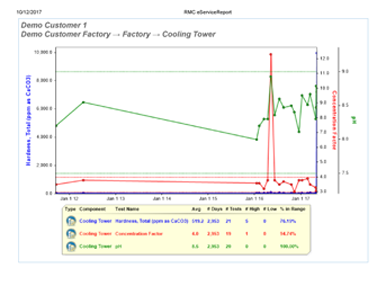
Data Analysis
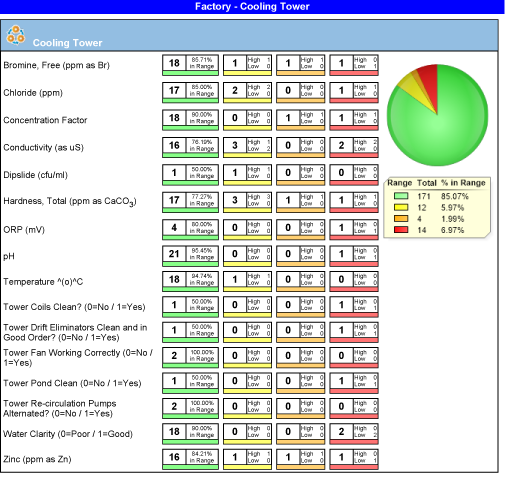
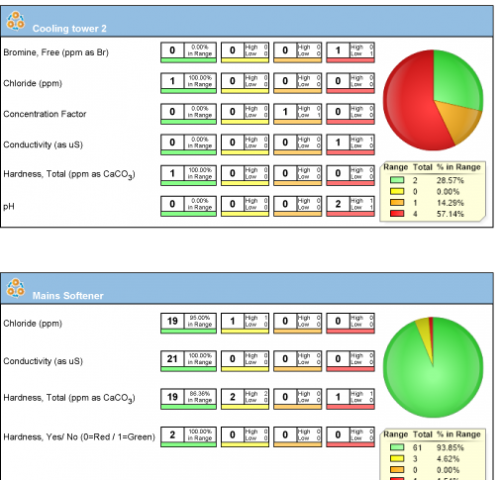
As one of the key features of sample report, all users have access to a variety of charting and graphing tools to analyze and interpret data. View up to four items at once on a trend report, including direct comparisons of data from controller, service, and operator reports. The system history report contains color-coded pie charts and can be used to view the performance history for each piece of equipment tested. Data can even be exported in Excel or CSV format for outside use.
Controller Compatibility
Unlike traditional controllers which are memory-limited to several months, Sample Report can store controller data for the long term. Many of the industry’s leading controllers can be configured to send data to eServiceReport via the Internet or phone line. This controller data can then be analyzed individually or trended against other wet test data. Data from the controller can also be easily used to calculate evaporation credits, inventory usage, and tower cycles. Compatible controllers can even be directly accessed from within eServiceReport. Inventory level entered is below the designated reorder point.
Files and Attachments
Users can upload and view documents such as PDF or picture files. Pictures of equipment inspections, coupons, and other useful items can be uploaded to the site and included in any report. Common documents such as equipment cleaning or storage procedures, training materials, test instructions, and other water treatment-related literature can all uploaded and accessed from within the site.
Easy to Access
- No software needs to be downloaded.
- Internet Explorer 5.5+ and an Internet connection are the only requirements.
- Updates and new features appear automatically.
- Quickly access up-to-date MSDS and Product Data Sheets.
- View pictures of equipment inspections, site layouts, and more.
Charts and Graphs
- Controller data logs may be compared with Sample Report and Operator Log test results.
- Daily, weekly, monthly, and annual product usage may be reviewed.
- Reported test results may be easily graphed and compared.
- All test results on a system may be viewed by easily accessing the system overview chart.
Files and Attachments
- Color-coded control limits provide an easy indication of test results.
- Test results are easily graphed and trended.
- Saved reports provide an overview of time spent and work performed.
- Reports that are emailed appear exactly as they appear online.